Elevation graphs - Faster, interactive, more features
Posted: Sat Mar 22, 2014 10:13 am
The elevation graphs on Map Pedometer have been completely redesigned. The new features are:
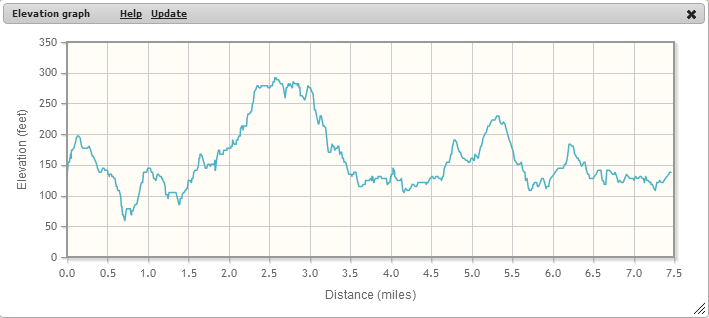
- Elevation graphs display much faster than the previous elevation graphs.
- Elevation graphs are now interactive. You can determine the exact route location of any point on the graph. Place the mouse cursor over data points on the graph to highlight the location on your route. Click on a data point on the graph to center the map on the selected point and highlight the location on the map.
- Elevation graphs on the Map Pedometer home page are resizable and can be moved to a new location on the page.
- The resolution for straight line route segments has been improved.
- The Elevation dialog on the Map Pedometer home page now has a help dialog which displays the features of the new elevation graph.
- The Map Pedometer Print Route page (http://www.mappedometer.com/routes/printroute.php) has been updated to optionally display elevation graphs.